One of the key advantages a Knowledge Base has over an FAQ page is its search functionality. Search gives us the ability to sift through hundreds, millions, or even billions of pieces of information in a few taps of a key.
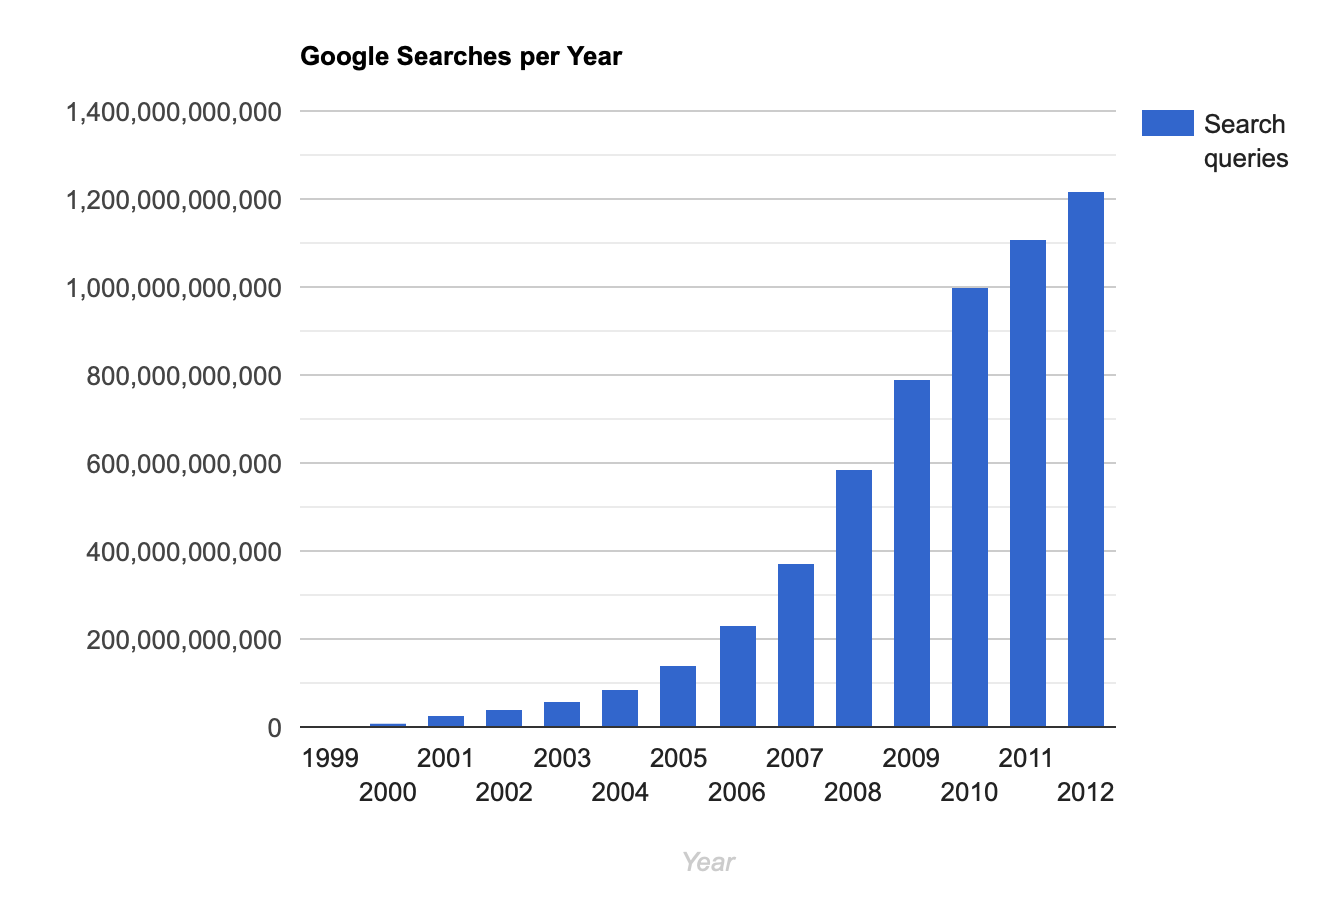
Google processes around 3.5 billion searches a day worldwide. Without it, we'd probably all be typing in websites manually. Search does dominate the web and it's saved me burning many a focaccia 🥲

We've gathered search data is valuable and all, but how do you use that data to impact users positively? For Google, they create predictive search autocomplete to speed things up a little—albeit with slightly strange results 😵
The weirdest set of google search autocomplete I have seen.
— Mick Darling (@mickdarling) April 25, 2021
“How to revive…”
Not sure how to feel about the order of likely seelections here. pic.twitter.com/b2MbkabBHJ
For Knowledge Bases, recording search analytics can help you improve and iterate the results that appear. But it's just data to start with, which isn't super helpful if you're not quite sure what to do with it.
In this post, I'll explore a few ways to use this data in your Knowledge Base software to create a better experience for users. I'll focus on the HelpDocs software but the concepts should be able to be used in other pieces of software too 💖
Tidy Up the Data
Ah, the internet is a strange place. People do some pretty strange things on it. So don't be surprised if there are a few weird keywords that come up in your search data.
“I recommend cleaning it up a little before you dive into the data.”
That's why I recommend cleaning it up a little before you dive into the data. In HelpDocs you can download your search data as a CSV.
💡 You can use Google Sheets or Airtable to collaborate as a team to make your search analytics useful.
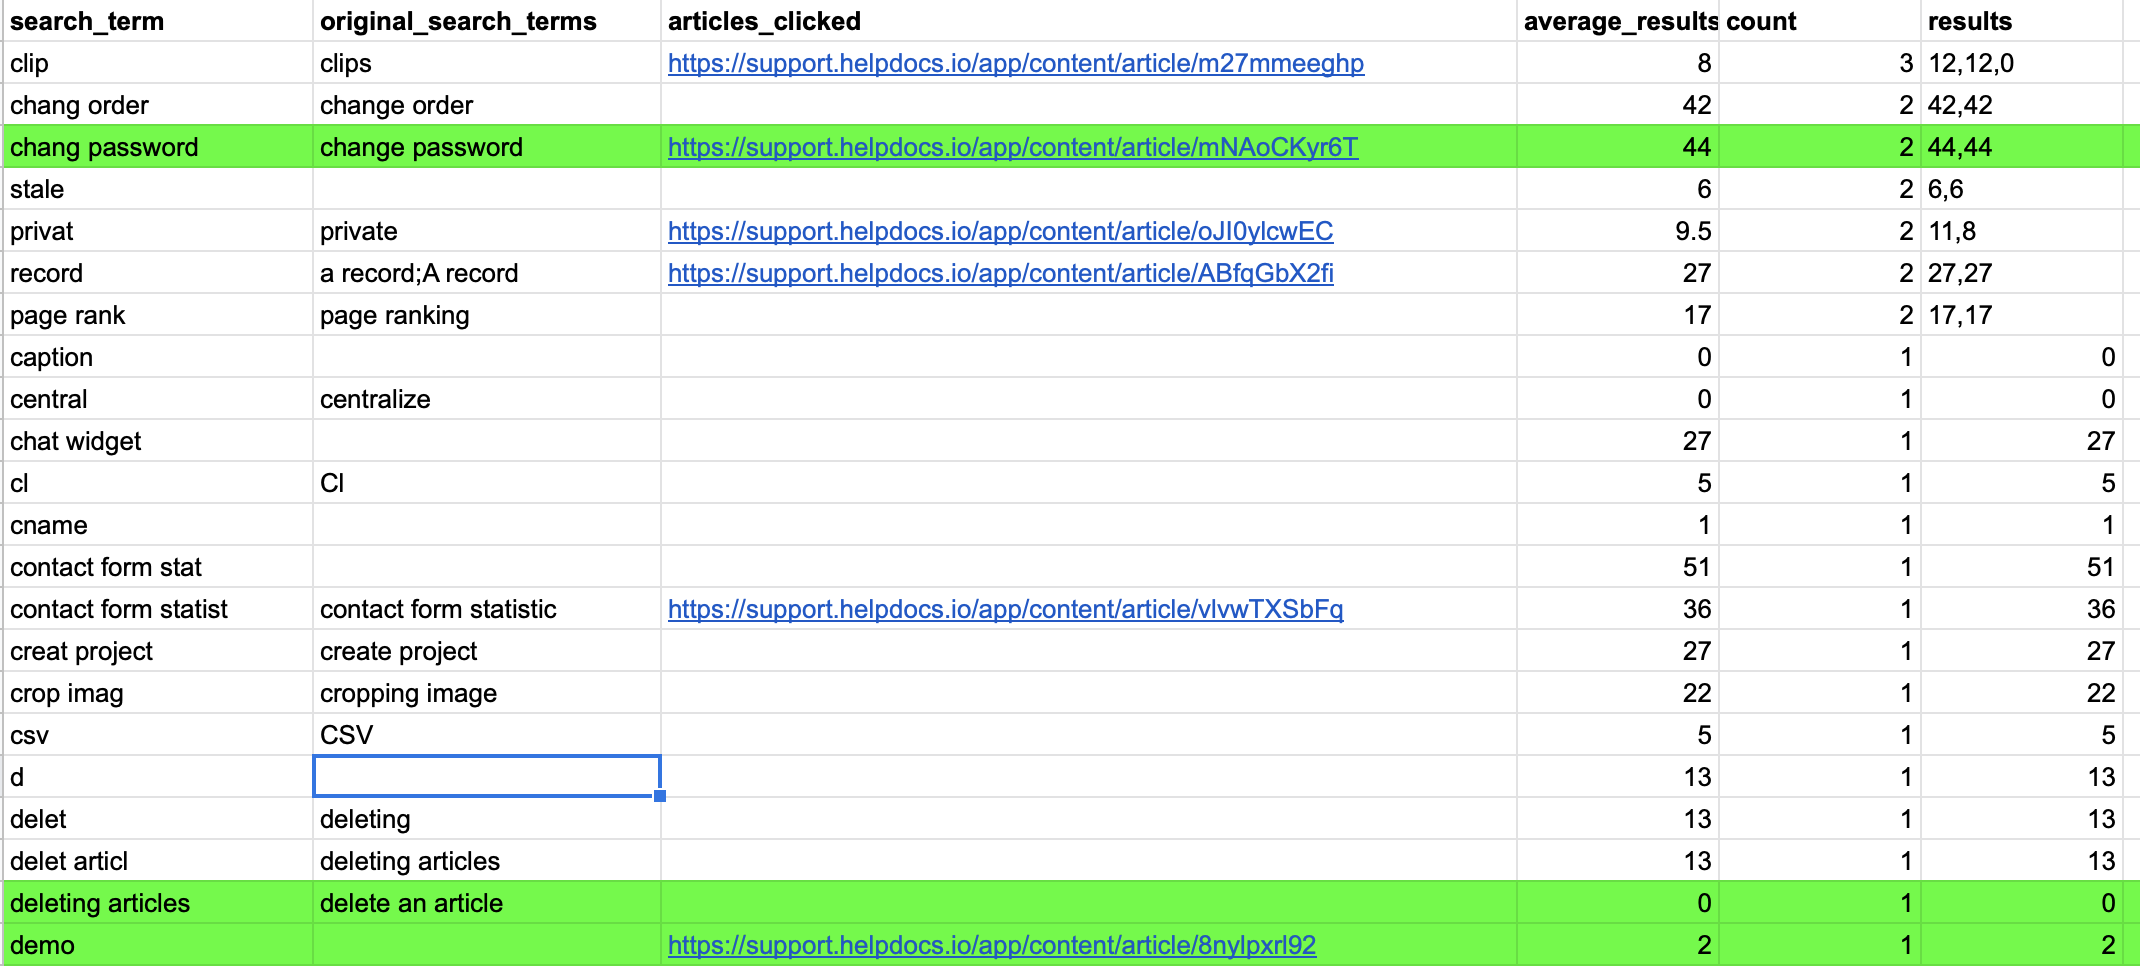
The downloaded CSV will give you a complete overview of the searches that have taken place on your Knowledge Base in the period, the articles that people clicked after searching for that keyword, and the number of times visitors searched them.

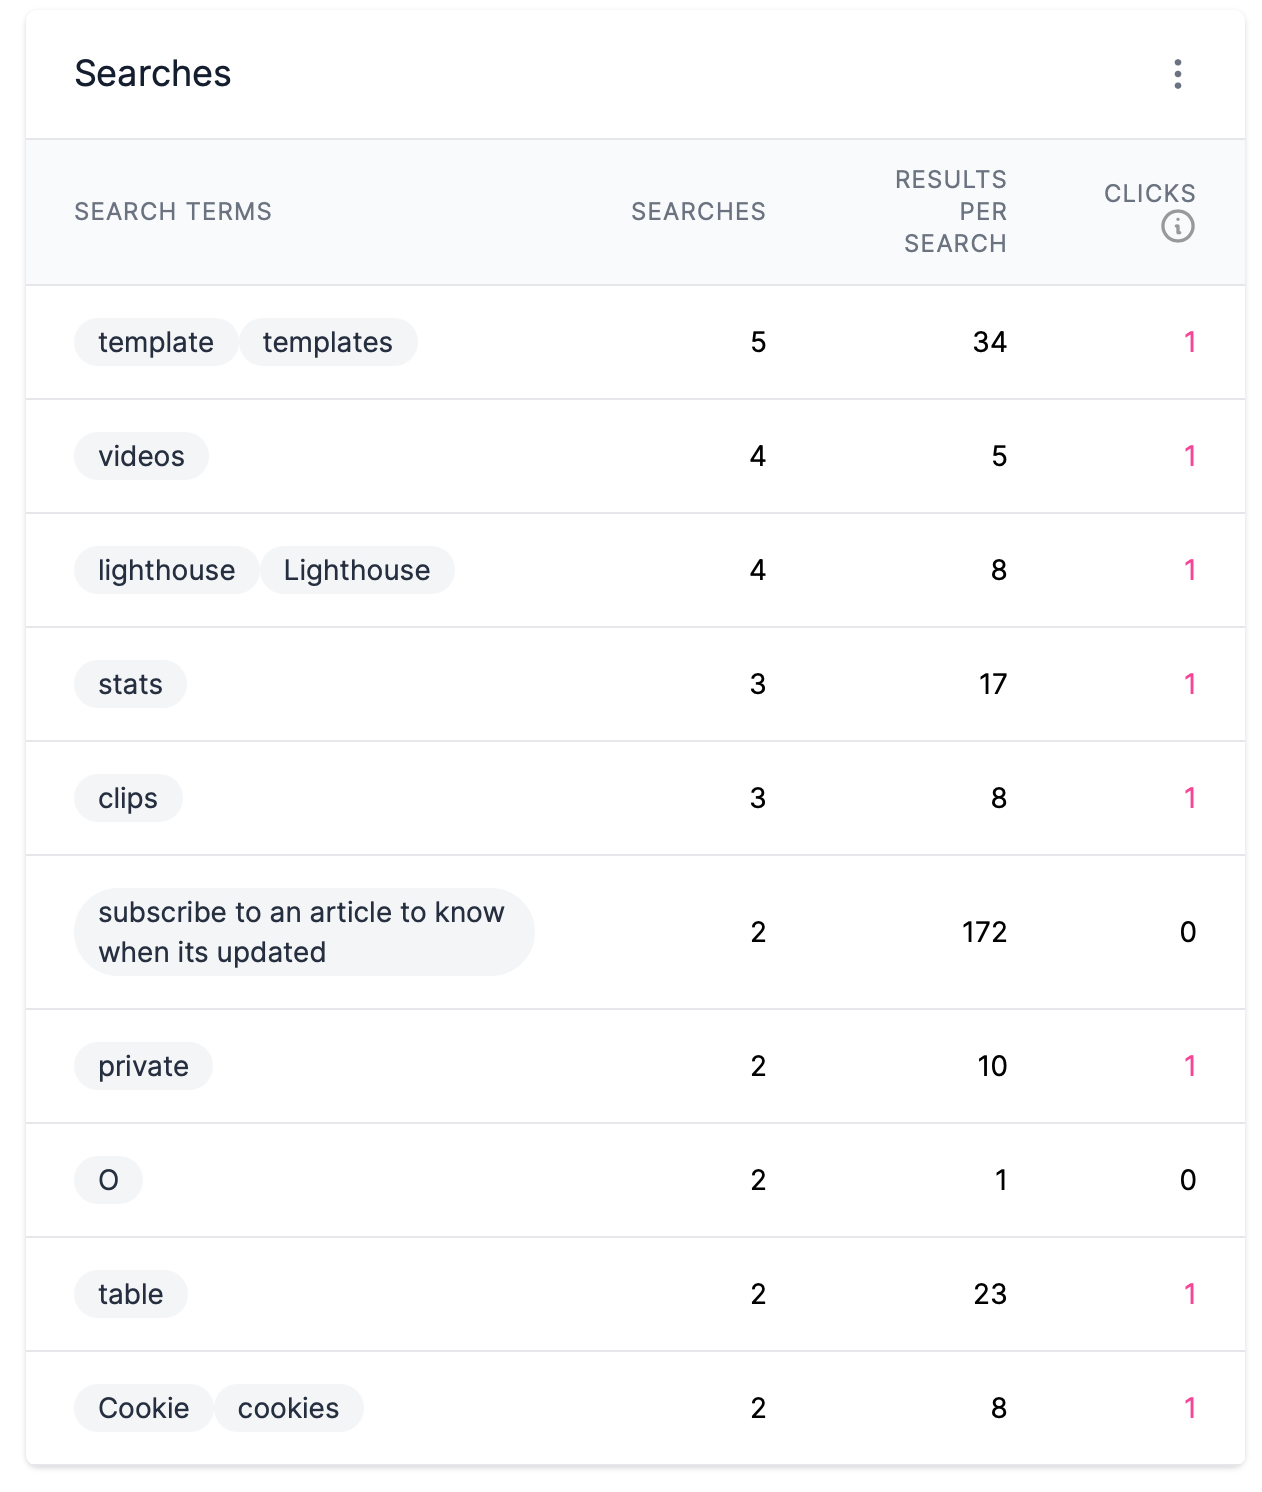
It should be relatively easy to spot the outliers. The table above you'll see the search term "O" seems a little out of place. While we think you should be able to see all your search data in your Stats section—even if it does look a little odd—you should filter the results sensibly.

I've pasted in a few example rows of search stats in the image above and highlighted the kind of data you'll probably wanna get rid of in red. "O" and "C" are not getting any results or hits. In general, you'll want to get rid of data with:
- Search terms that don't make sense. Just like the O and C rows above
- Searches with one count. There's not much point in looking at these since they're so unpopular.
- Rude search terms. These unfortunately do happen sometimes and they're not worth your attention 😬
Once you've tidied up your data you'll be in a much better position to collaborate and make a difference with your stats.
Sort the Search Data into Buckets
You've sifted and filtered your Knowledge Base search analytics to eliminate any outliers that don't make sense. Next, you'll want to start making sense of the data you have left.
“A lot of the time you'll find you're doing a pretty good job writing about topics customers want to read.”
It's like turning loose sand into a sandcastle. Without whacking your sand scooper into the bucket it's not impressive. It's only when shaped that it becomes something else entirely.
You'll be able to sort the data into three different buckets. I'd recommend going for a color-coded system by highlighting the various rows 🪣
1. Topics you have good documentation for already 👍
A lot of the time you'll find you're doing a pretty good job writing about topics customers want to read.
If you're an eCommerce company this might be about shipments or sizing. If you're a SaaS company it could be about features that already exist in your software that users discover.
Whether you ship threaded t-shirts or software you'll find these are some positive signs your Knowledge Base search is going swimmingly:
- Did people click on relevant articles for the search terms? You can determine whether search terms hit the mark by looking at the articles_clicked column and finding a link to your article. Seem relevant? You've done great 👍
- Search terms that get between 1-15 results. Having too many results can make it difficult for your user to navigate and find the most relevant articles. Check the average_results to see how many people got on average—anything below 10 is ideal 👌
Let's take a look back at my data and see a few examples of good documentation in the search data:

I've highlighted the goodies in green. Here's why:
- "change password" is excellent because the article clicked URL goes straight to the How do I reset my password? article
- "deleting articles" has a good amount of average_results
- "demo" is wonderful because the article clicked URL goes to the Can I Schedule a Demo? article
2. Topics you need more documentation for 👎
Topics you need more documentation for is fairly self-explanatory. People are searching for the information but it's not there. So you need documentation for it.
As apparent as it is it's still helpful to categorize it. It'll give you a useful overview of all your search terms 😌
So how do you find the topics that need more documentation from your search term list? To make things easier sort by the count column—this will tell you how popular that search term is. The higher the amount of times someone has used that search term the more popular it is.

As you can see in my data "clips" is the most popular search term. However, when I look at the articles clicked URL it heads straight to the Managing Clips article which means it's got the documentation it needs already.
As I scroll down I can see a few more search terms I know have supporting documentation already. The first one that catches my eye is "page rank". I've highlighted it in red below:

There's a few reasons this needs more documentation:
- It has 17 average_results which is above the 15 I mentioned earlier
- It hasn't got an article_clicked URL
For these reasons I'd put them in the needs more documentation bucket for sure.
3. Product suggestions 🤔
Search terms that aren't relevant right now aren't lost. No no, you can use these to your advantage. You can see what customers want in terms of a new product or feature.

Above there's a suggestion that a Shopify integration would be useful. Maybe we would decide to put that on the roadmap after discussing it as a team.
Because people are going to your Knowledge Base to see if you do this or that, it's usually a treasure trove of product suggestions. Neat eh?
Putting It All Together
You've filtered your data. You've sorted it into buckets. Now it's time to dig into it and plan some articles based on it.
When looking at the more documentation bucket see if there's existing content for that search term. It's easier to carve down current article results than create new articles altogether.
If you find some content you can add a tag with that search term. It'll give more precise results next time to help your visitors out.
And if there's no content? Don't sweat it too much right now. Instead, add a new column on the same row with a draft title and some notes. The title and note will help you when you go back to write the actual article later.

💡 Add a task on your to-do software to go back and check the list with your teammates. They'll probably have some knowledge to share on the topic you wanna write.
And what about the product suggestions bucket? You'll wanna go through that with your product and support teams to see whether they're a good fit for your roadmap.
Smart Decisions Based on Knowledge Base Search Data
There we have it! A way to filter, sort, and take action based on your search analytics for your Knowledge Base. It's never easy to stare at a list of search terms and work out what to do with the data.
With this method you'll be sorting out and compiling new content in no time. You'll also find trends in what customers are looking for in your product whether that's a new fashion line or a feature to import data.